
(Sydney | Melbourne | Perth | Brisbane | Australia)
If you’ve ever run a digital campaign and wondered, “Is this ad actually making money?” — welcome to the most misunderstood metric in marketing: ROAS (Return on Ad Spend).
Every digital marketing agency in Australia talks about ROAS. Few can truly measure it.
What Is ROAS (and Why It’s So Elusive)?
ROAS is your campaign’s scorecard — how much revenue you earn for every dollar spent on ads.
Simple math, right? Not exactly.
In theory:
ROAS = Revenue / Ad Spend
In reality, it’s tangled in attribution, cookies, offline conversions, and delayed sales.
For example: someone clicks your Google ad today, signs up for your email, then buys next week from a Facebook remarketing campaign.
Who gets credit? The PPC agency? The email team? The SEO firm that ranked your blog first?
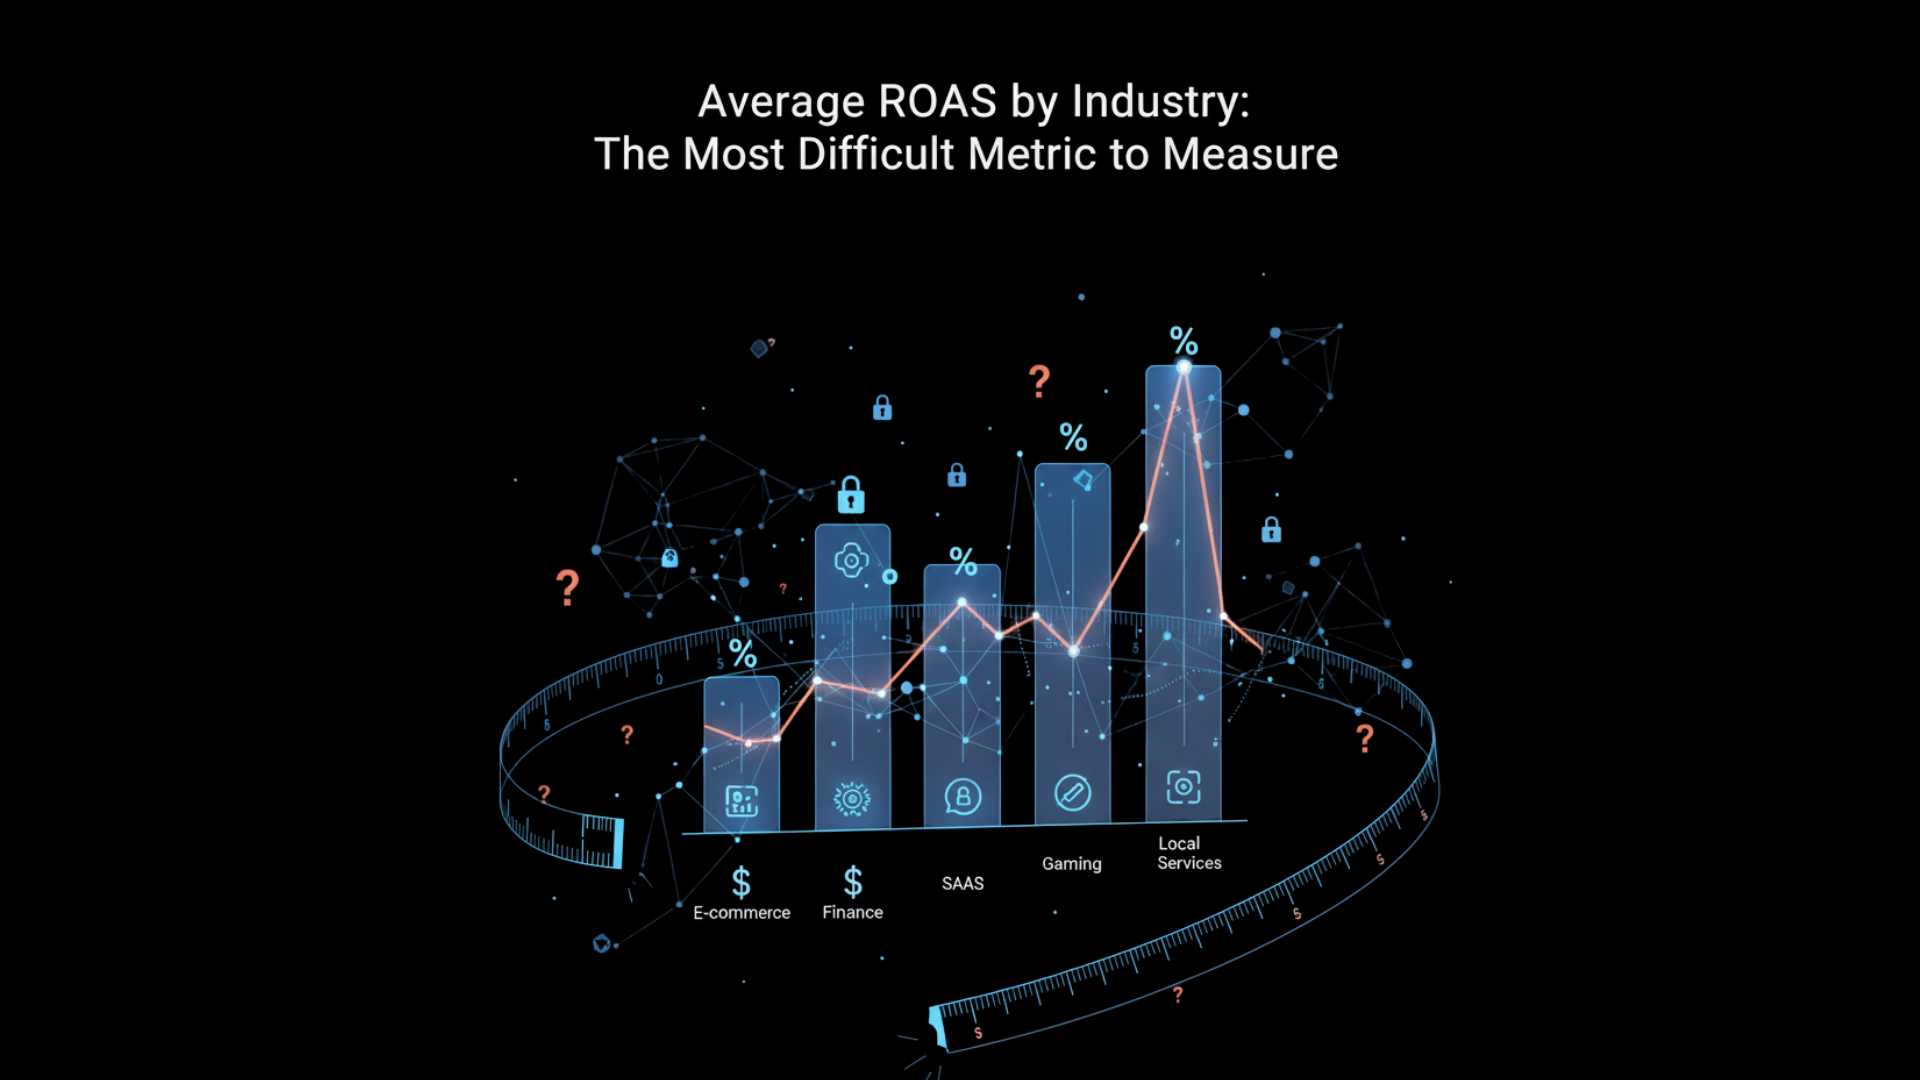
That’s why marketers call ROAS “the most difficult metric to measure.”
The Industry Averages (and Why They Don’t Tell the Whole Story)
While numbers vary, here’s what top performance marketing agencies in Australia see across sectors:
Industry Average ROAS (AU) Notes
- E-commerce 3.5x – 6x High ad spend, instant tracking
- Real Estate 2x – 4x Long conversion cycles
- Education 4x – 8x Strong remarketing loops
- Healthcare 3x – 5x Strict ad compliance
- B2B & SaaS 2x – 3x Attribution complexity
- Fashion & Lifestyle 5x – 10x Impulse-driven conversions
But beware: these are benchmarks, not guarantees.
Your ROAS depends on data quality, tracking setup, and creative performance — not luck.
Short-form vs. long-form video content: Definitions
Why ROAS Is So Hard to Measure
- Multi-Touch Journeys
Customers might click five ads, read two blogs, and watch a reel before buying.
Each touchpoint matters — but most analytics tools give credit to the last click only.
- Cross-Platform Campaigns
If your PPC advertising firm and social marketing agency don’t share unified data, your reports are skewed.
- Offline or Delayed Purchases
In industries like real estate or consulting, sales happen weeks later — often through calls, not clicks.
- Cookie Loss and Privacy Updates
With iOS updates and cookie restrictions, tracking accuracy has dropped by nearly 40% since 2022.
That’s why smart digital marketing agencies in Sydney, Melbourne, and Perth rely on AI-driven attribution and first-party data integration
How to Improve and Accurately Track ROAS
Use Server-Side Tracking – bypass cookie loss with GA4 and Meta’s Conversions API.
Align SEO, PPC, and Email Marketing – one team, one dashboard, one truth.
Audit Your Attribution Model – last click ≠ real performance.
Invest in Data Analytics – Power BI or Tableau turn chaos into clarity.
Segment by Campaign Type – measure search, display, and social separately.
Top digital marketing companies in Australia use machine learning to forecast ROAS trends, helping brands allocate budgets with confidence.
The Proof in Numbers
Businesses using cross-channel tracking report 37% higher ROAS.
Brands in Australia integrating AI saw 28% better ad efficiency.
Unified dashboards cut reporting errors by 42%.
That’s not hype — that’s precision.
Final Takeaway
ROAS isn’t just a number — it’s your business pulse.
But without clean data, it’s like driving with fogged-up glasses.
"ROAS is a mirror, not a yardstick. You can't compare your reflection to anyone else's, because every industry and every campaign casts a different light on the average."
— Avinash Kaushik, Digital Marketing Evangelist
Whether you’re running e-commerce ads in Brisbane, a lead-gen campaign in Sydney, or SEO-PPC integration in Perth, focus less on chasing a “perfect ROAS” and more on understanding how it’s built.
At AI Marketing Lab, we don’t guess — we measure what matters.
We combine AI precision, human creativity, and transparent analytics to turn ad spend into predictable growth.
So next time someone says, “What’s your ROAS?” — you’ll have the data and the confidence to answer.


What do you think?
Very informative. I appreciate the effort.
Thank you for your feedback. Follow us and share it for more informative topics to discusss.